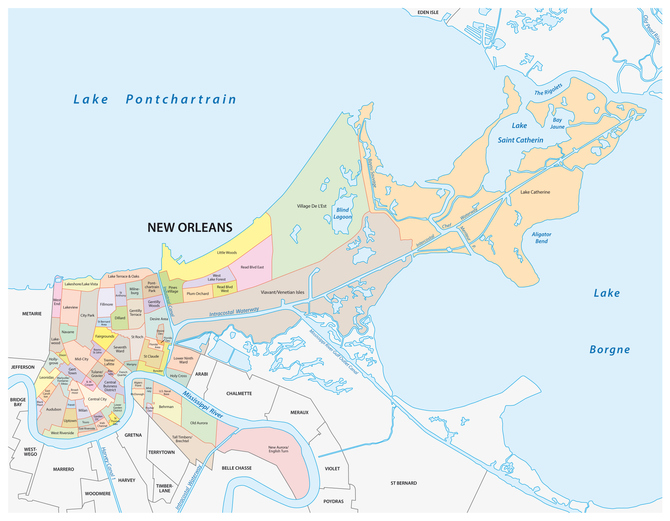
This last year of real estate in New Orleans was wild. Filled with bidding wars, anxious buyers, and unrelenting sellers, the over New Orleans metro area saw an increase of 9% in sales prices. However, many want to know what these price adjustments look like in their zip code. The percentages we are presenting for you are price increases or decreases between 2020 and 2021.
Here is the breakdown of the zip codes in the city and beyond:
New Orleans
- 70112: down 20%
- 70113: up 30%
- 70114: down 24%
- 70115: down 1.4%
- 70116: down 18.6%
- 70117: up 10.9%
- 70118: up 43%
- 70119: up 1.6%
- 70122: up 14%
- 70124: up 6.7%
- 70125: down 8%
- 70126: up 16%
- 70128: up 74%
- 70130: up 16%
- 70131: down 6%
East Bank Jefferson Parish
- 70121: down 20%
- 70123: up 34%
- 70001: no changes
- 70002: down 36%
- 70003: up 9.8%
- 70005: down 18%
- 70006: down 16%
- 70062: up 46%
- 70065: down 6%
Arabi & Chalmette
- 70032: up 2%
- 70043: no changes
West Bank
- 70053: down 15%
- 70056: down 2%
- 70058: down 3%
- 70072: up 13%
- 70094: up 20%
- 70037: up 8%
Before you read too much into these numbers, please remember that some had huge increases because blighted properties were brought back to life and sold! The areas with price decreases may have been more sales of fixer-uppers. Before you panic, get in touch with your trusted real estate agent to take a look at your exact area!
Want to talk about buying or selling a home? Text us!
